Cyclic Immunofluorescence Multiplexed Imaging
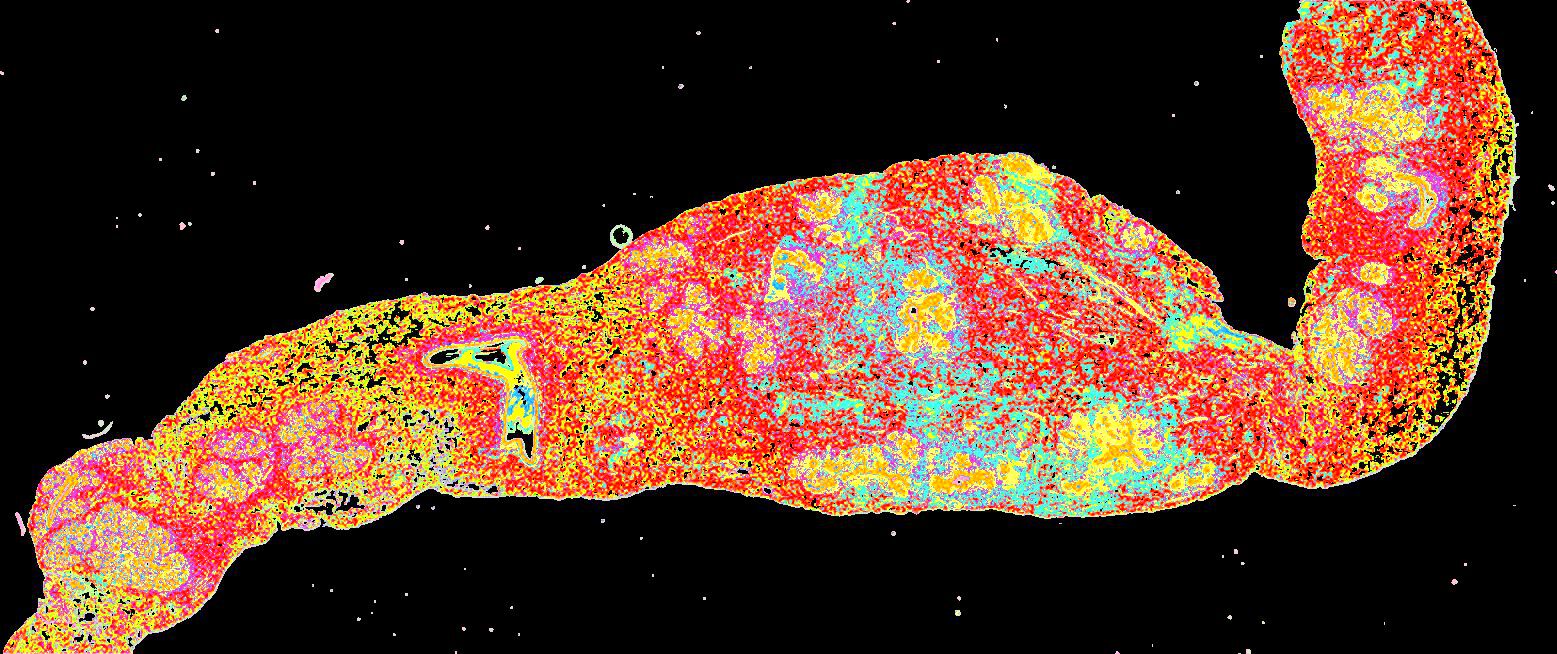
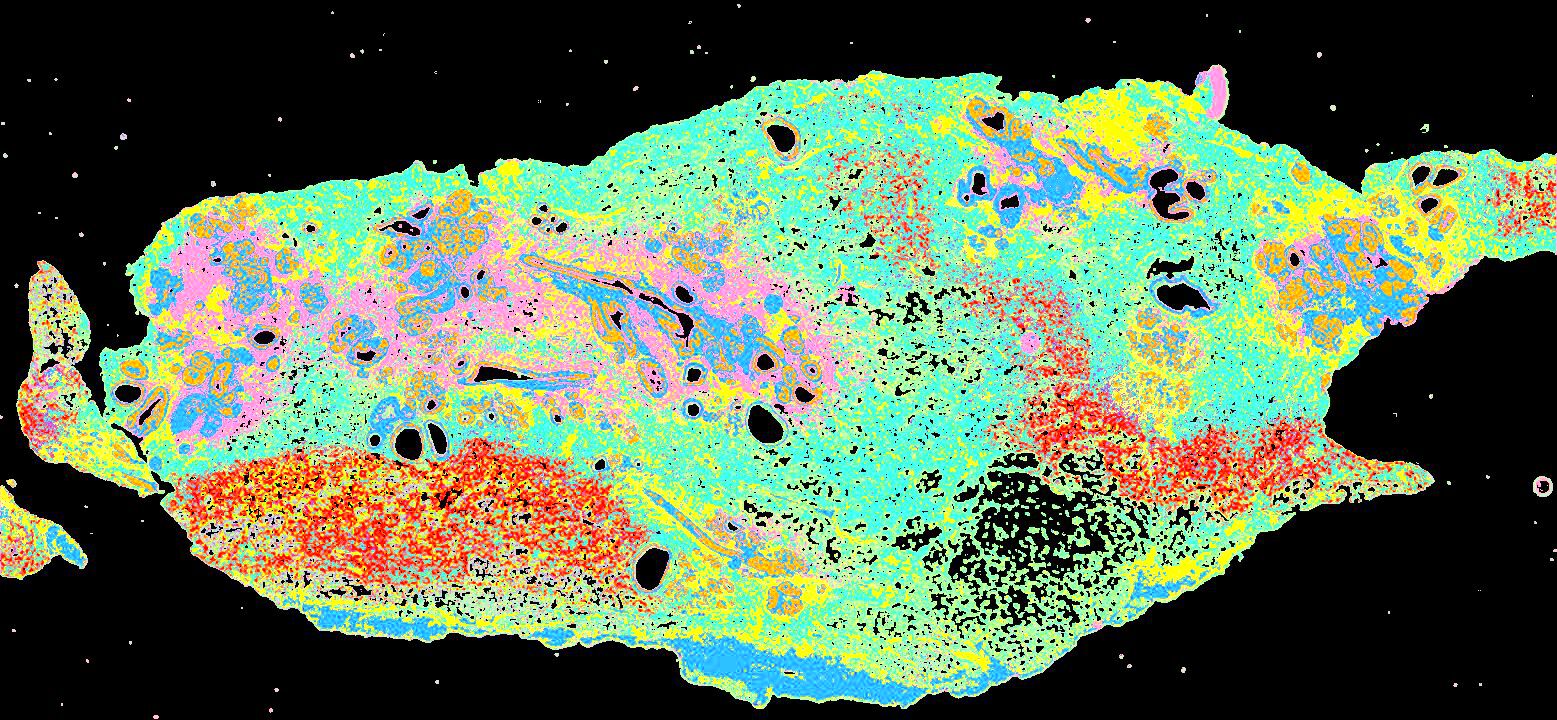
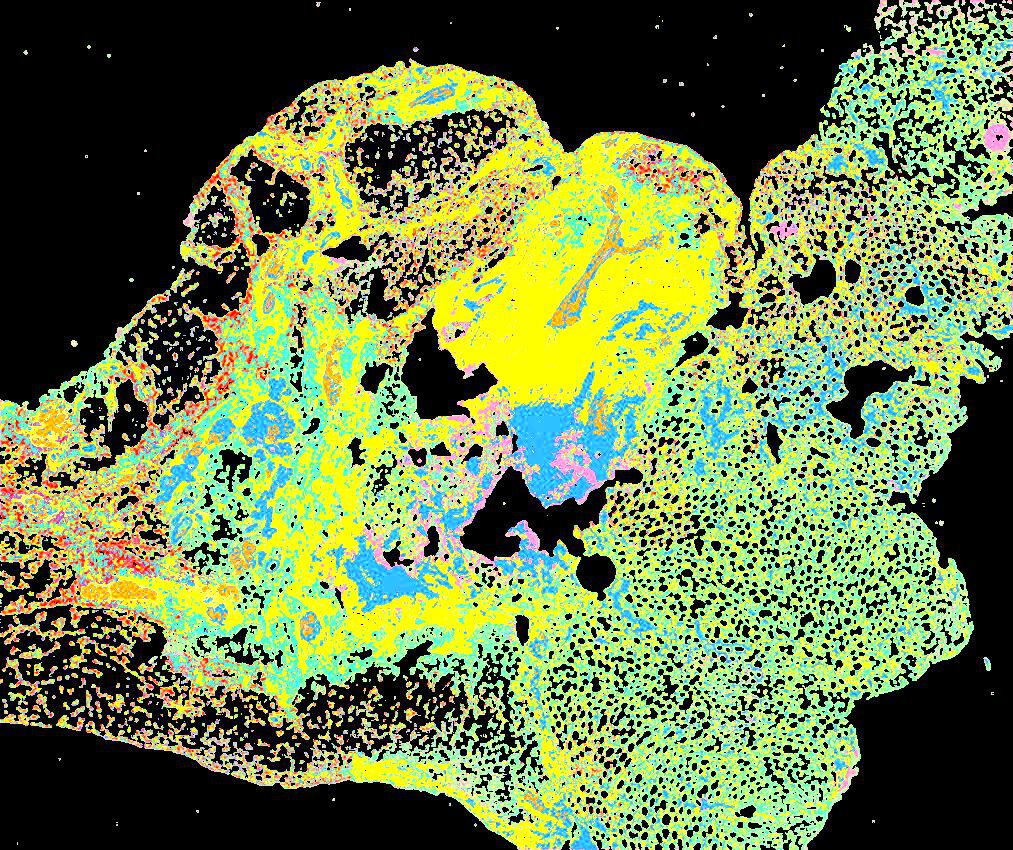
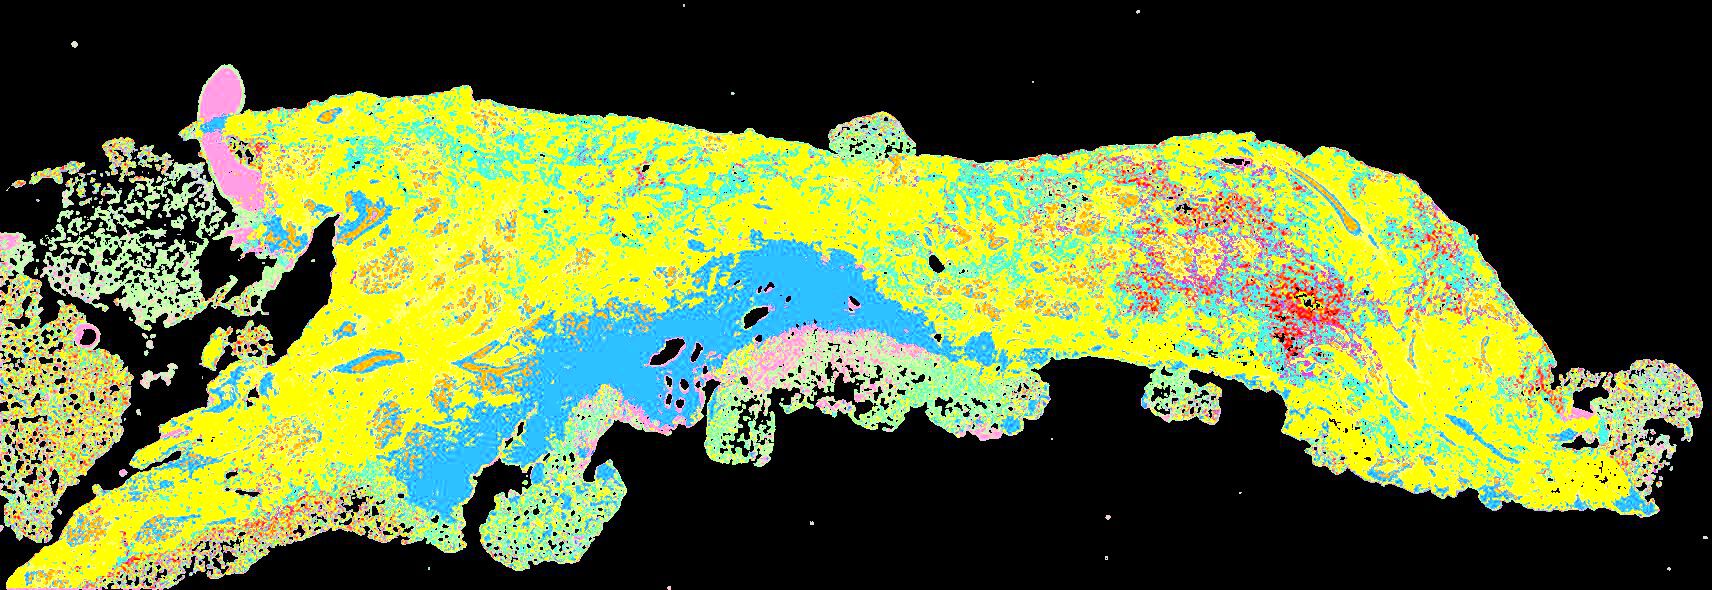
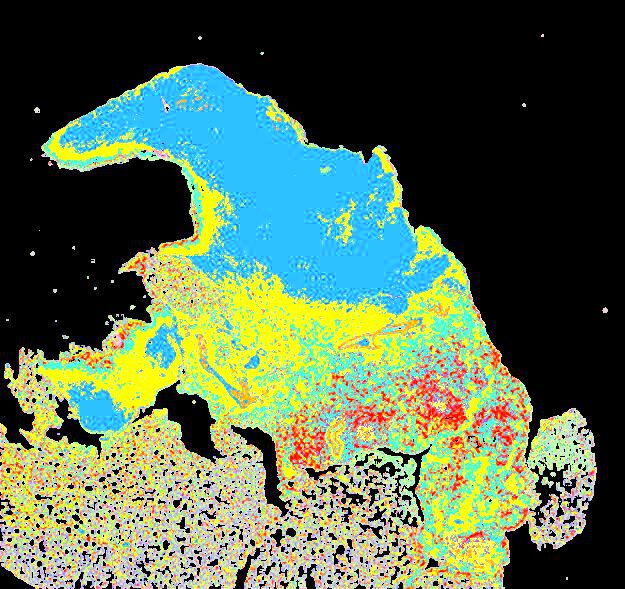
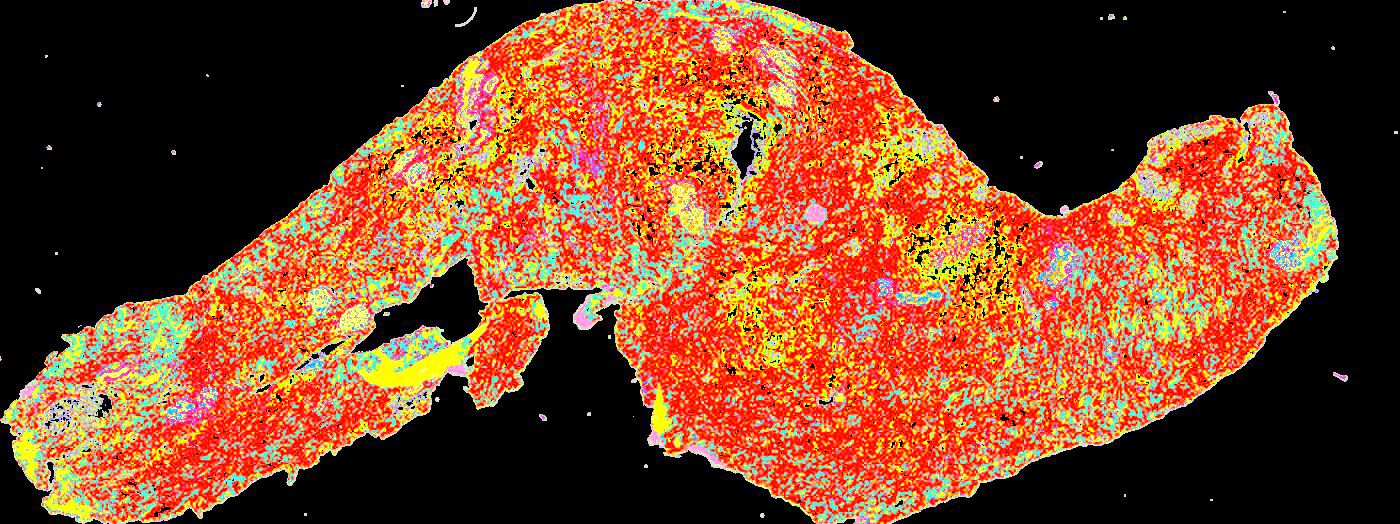
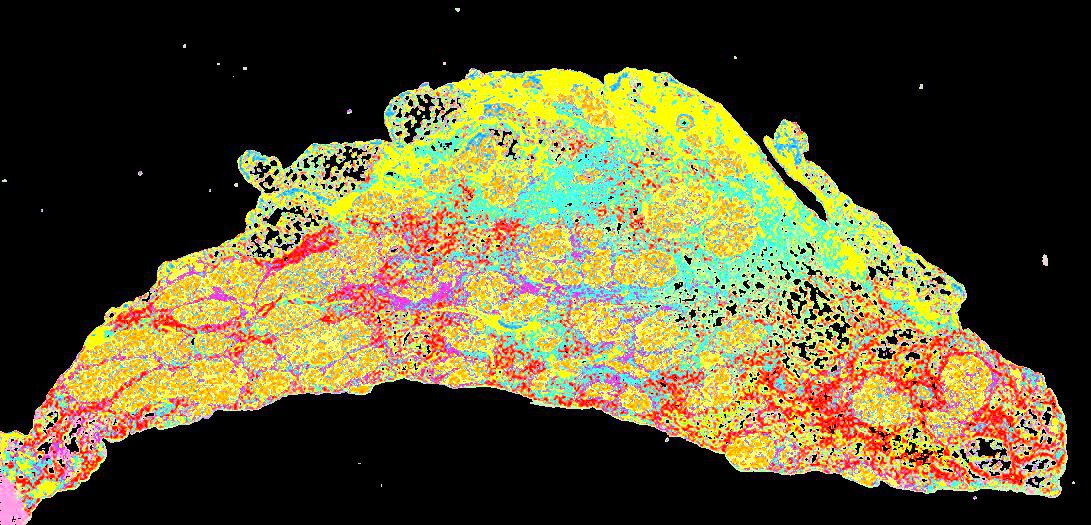
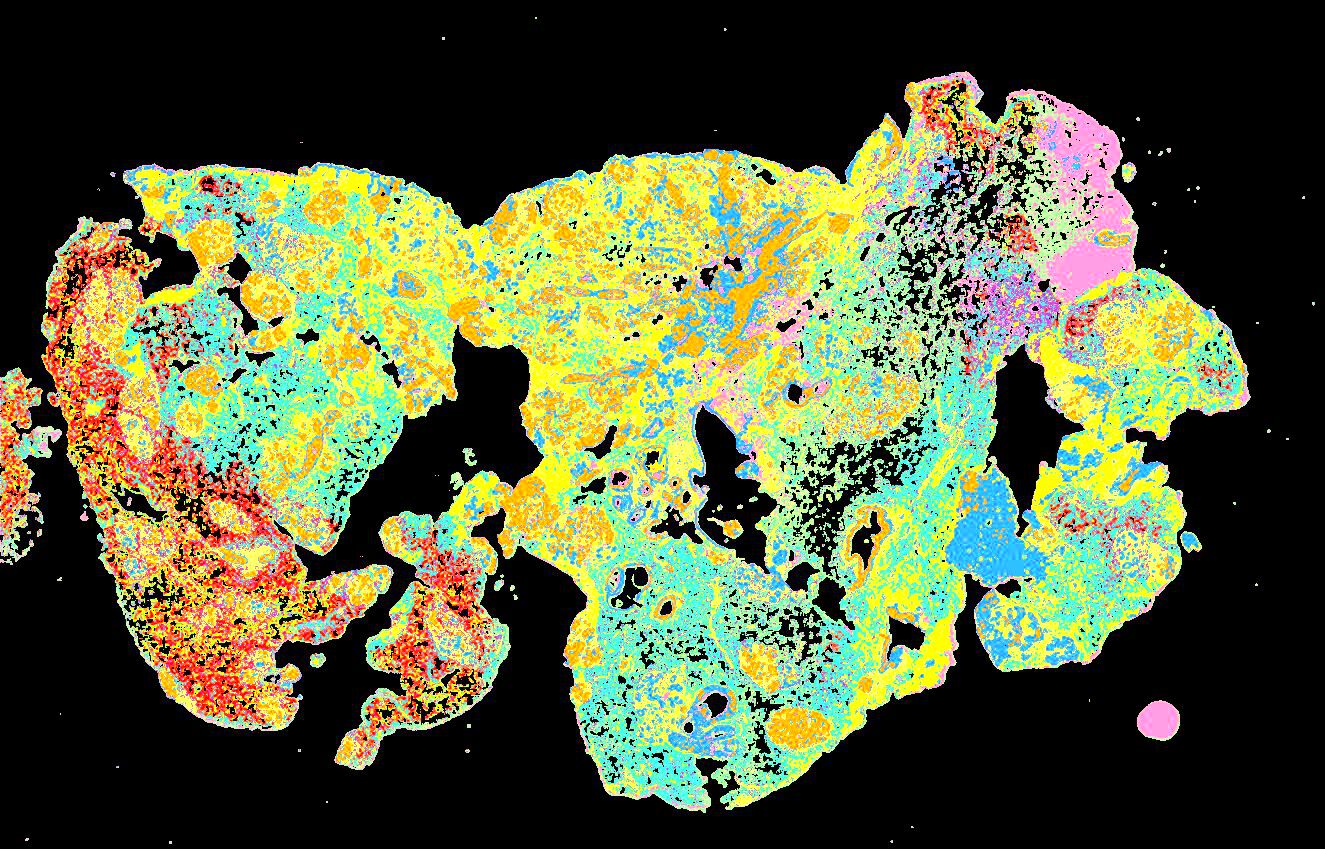
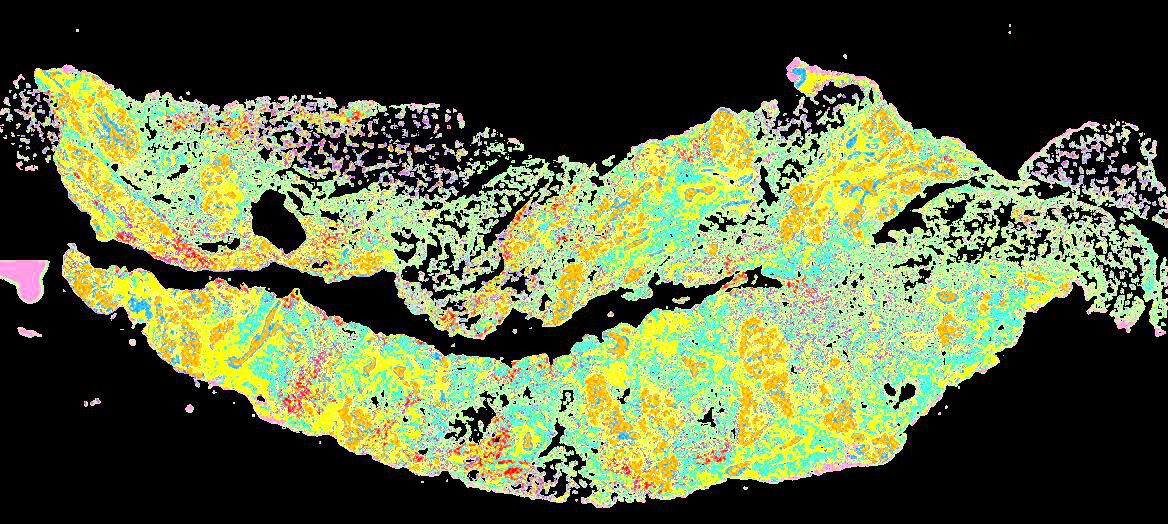
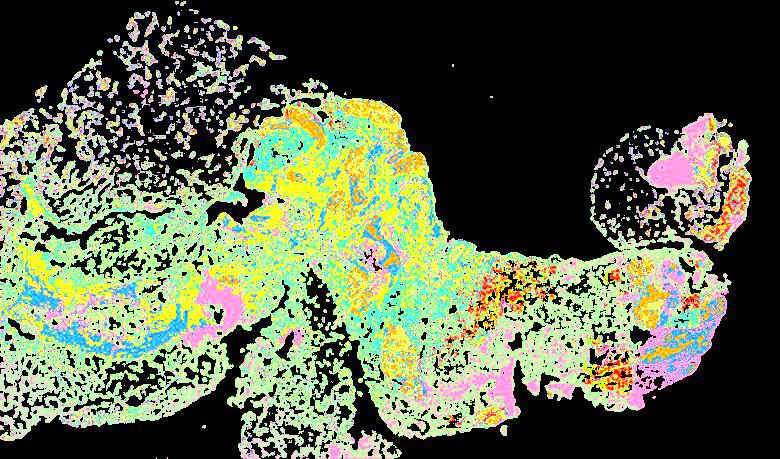
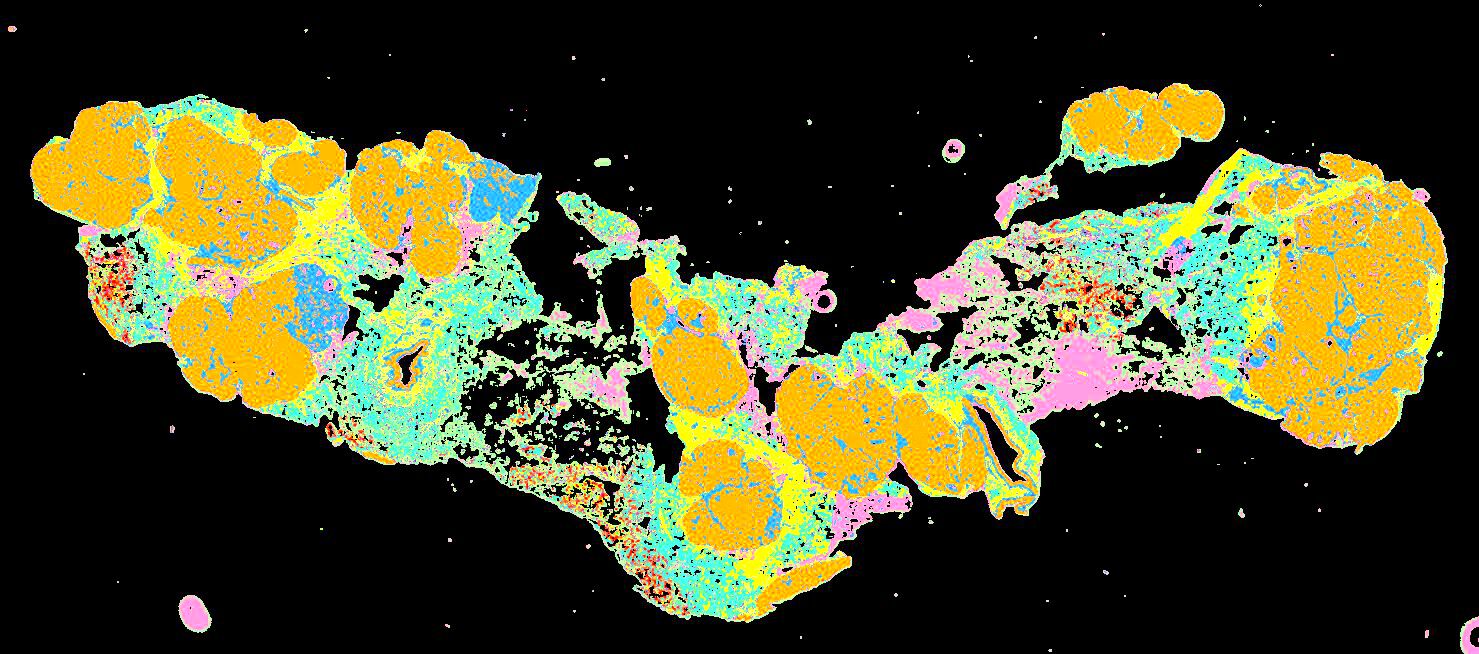
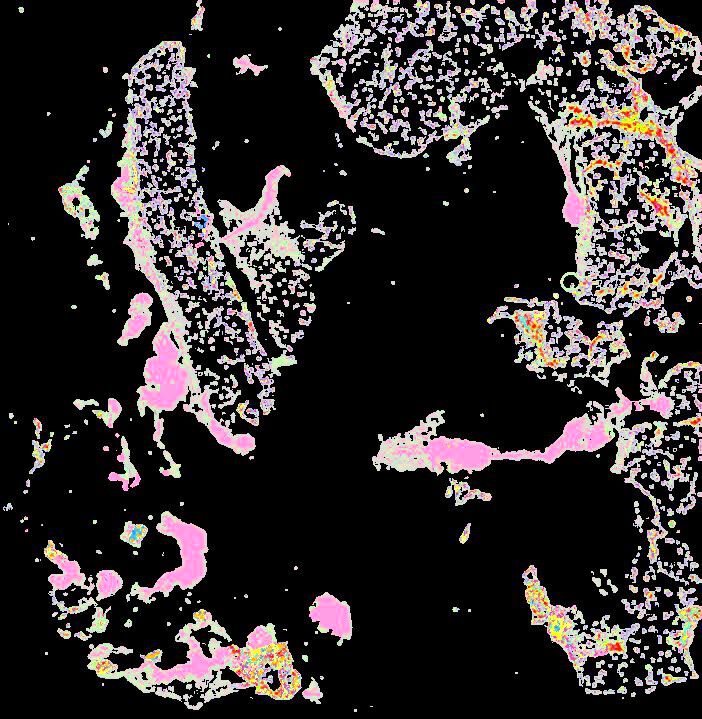
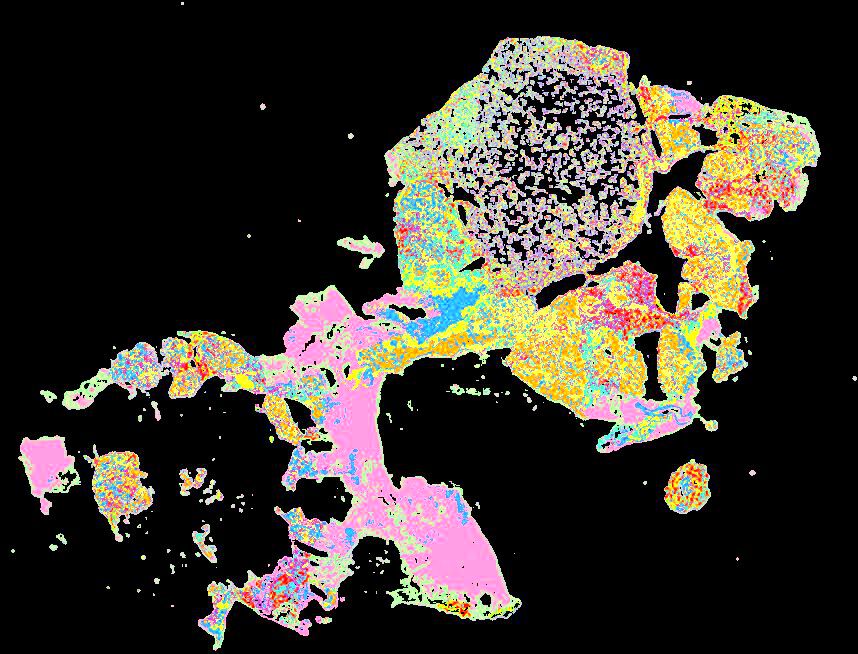
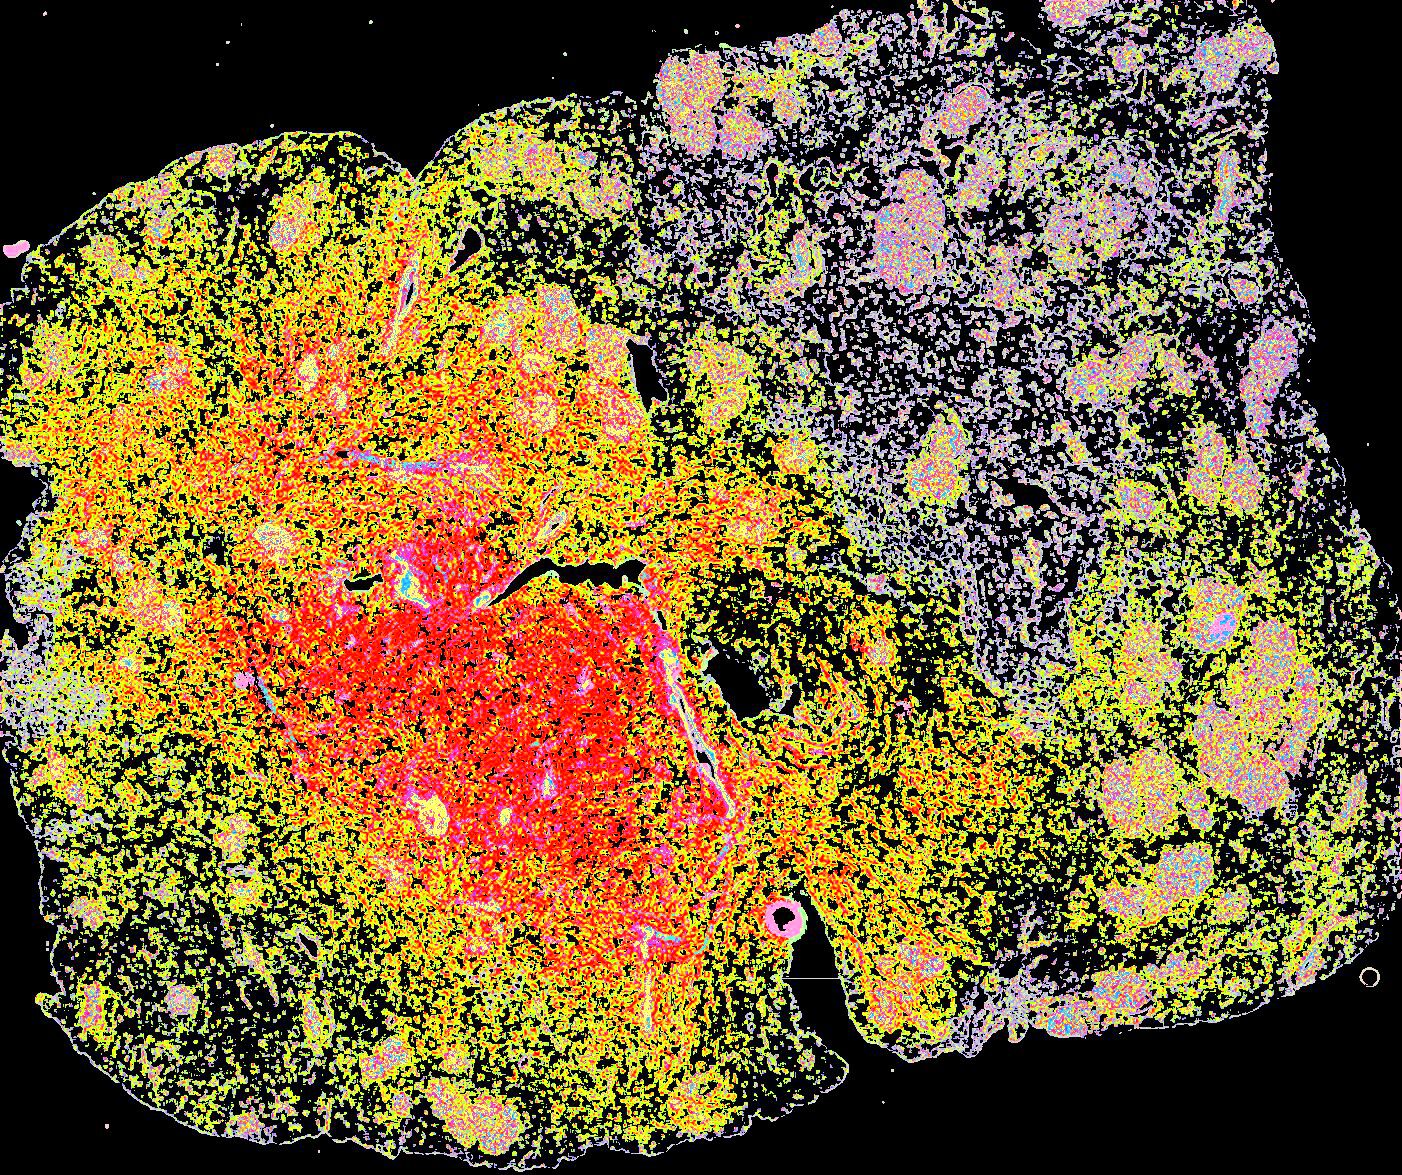
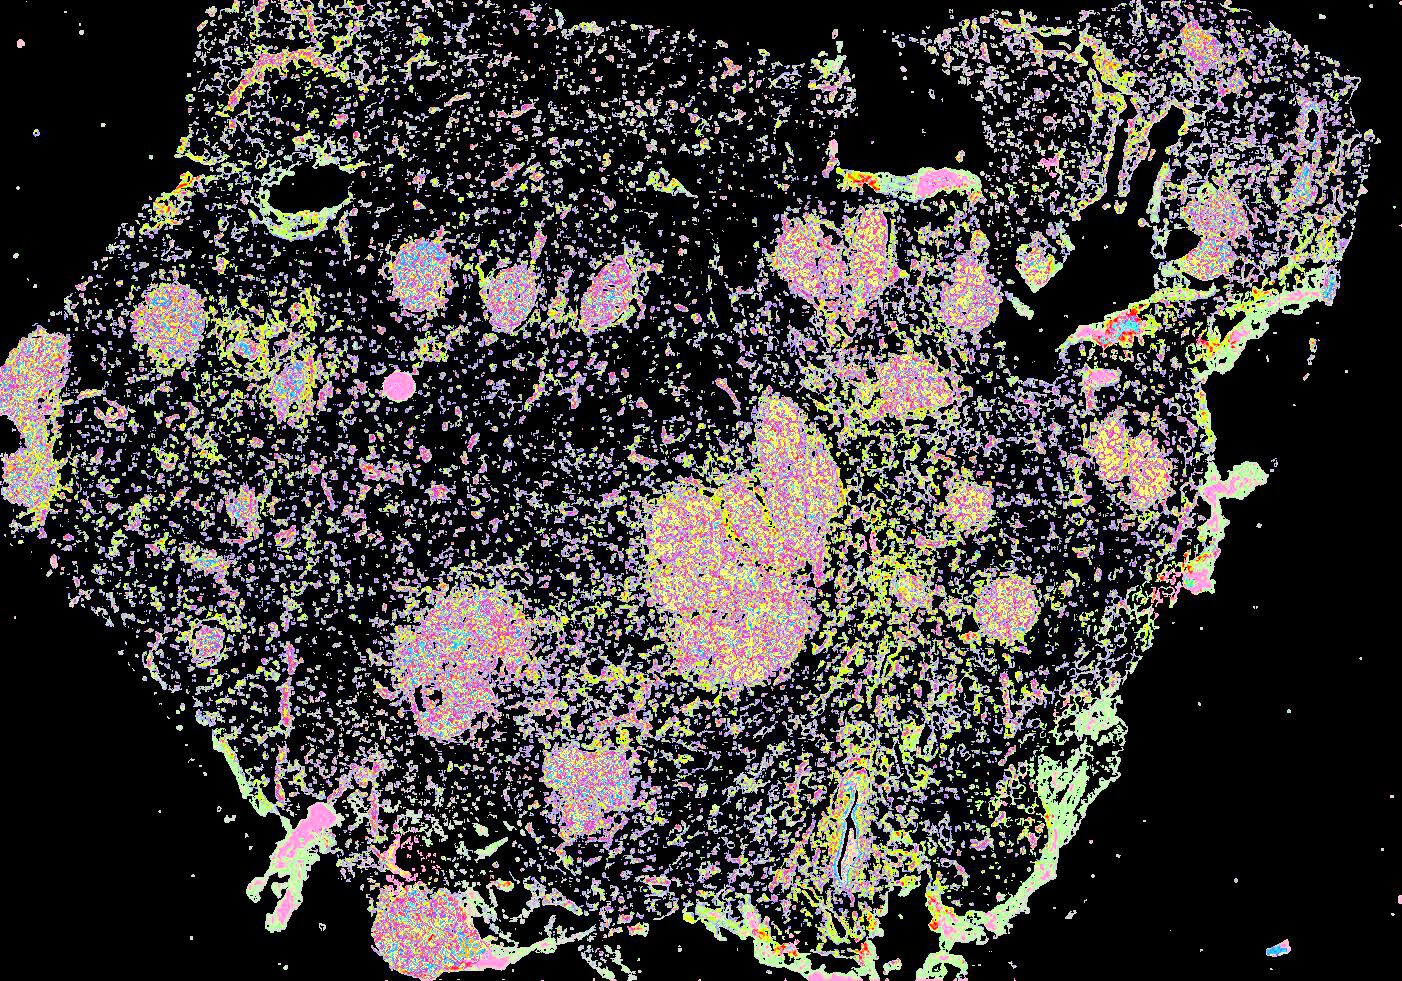
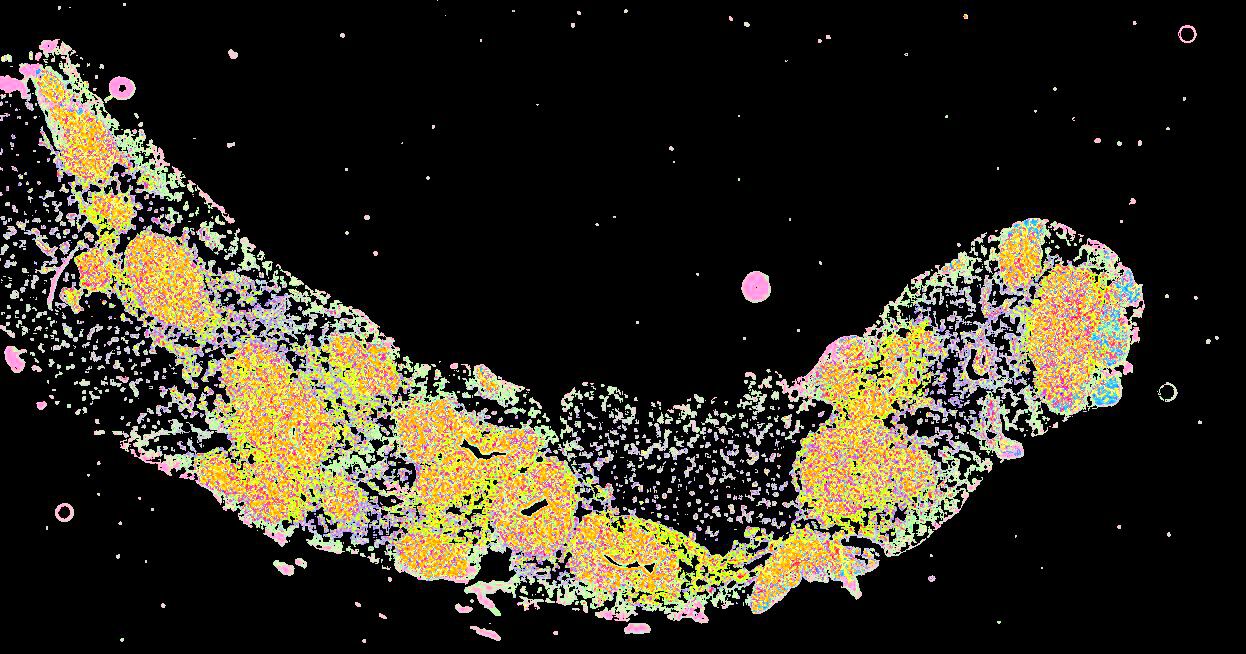
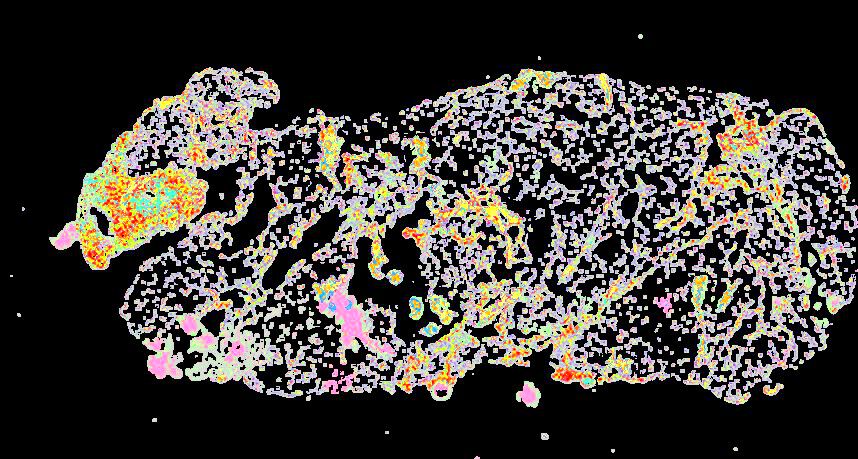
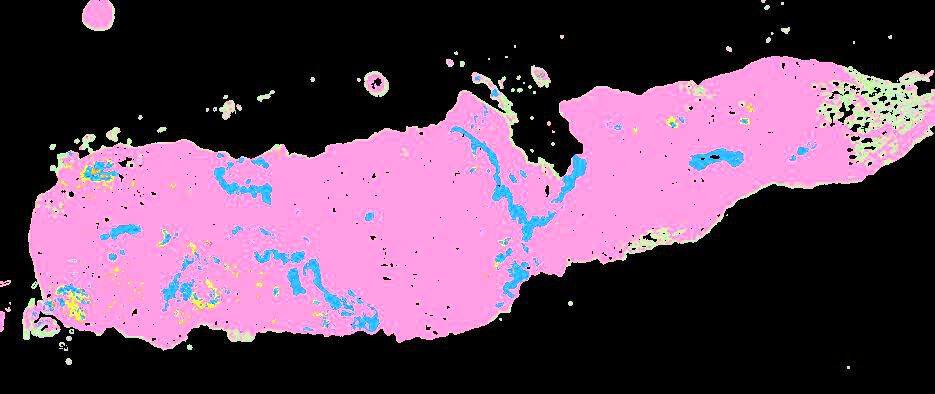
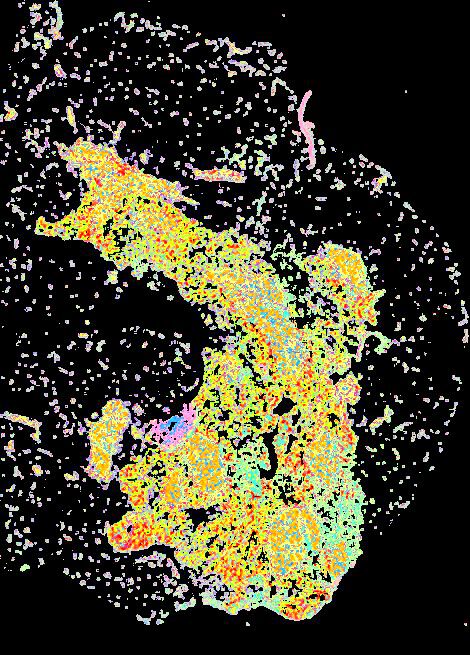
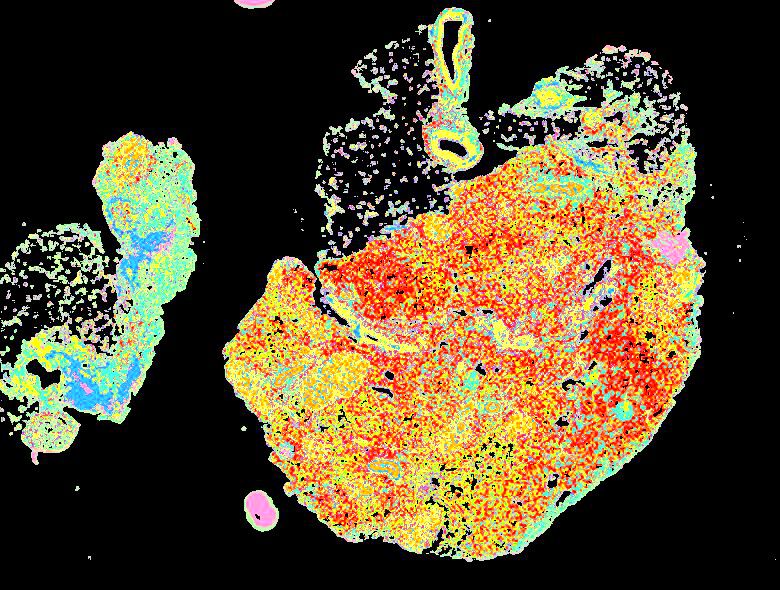
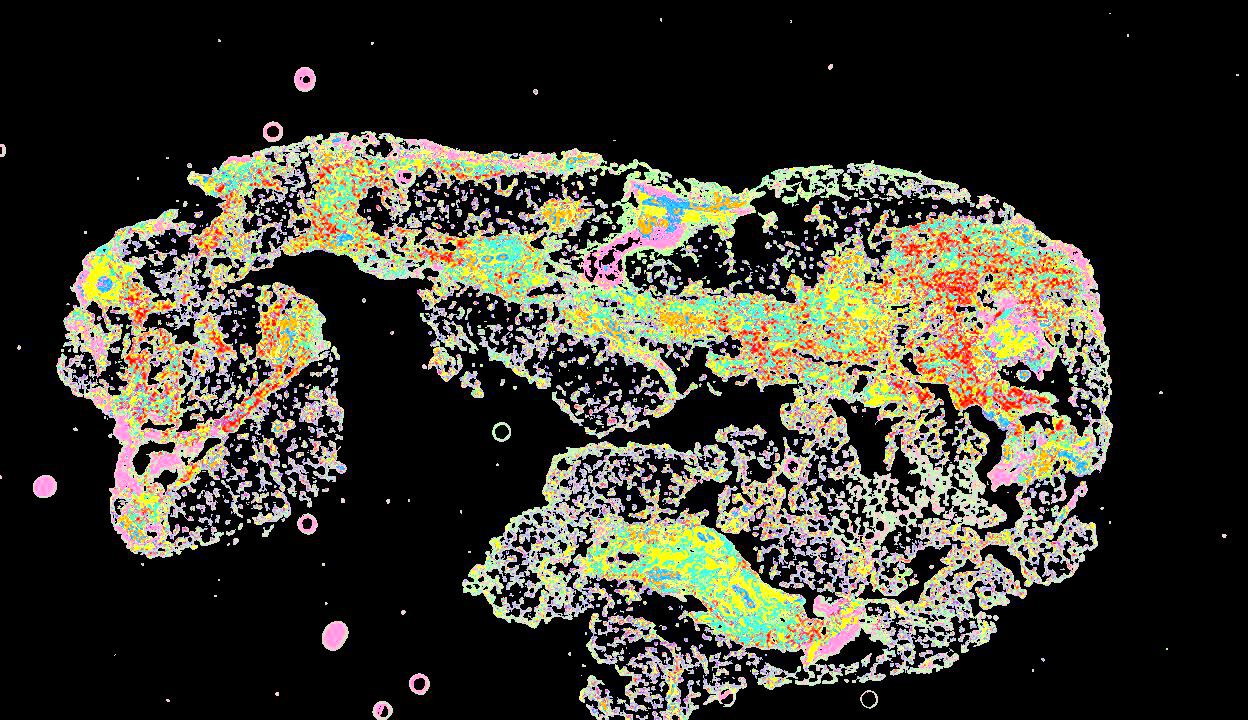
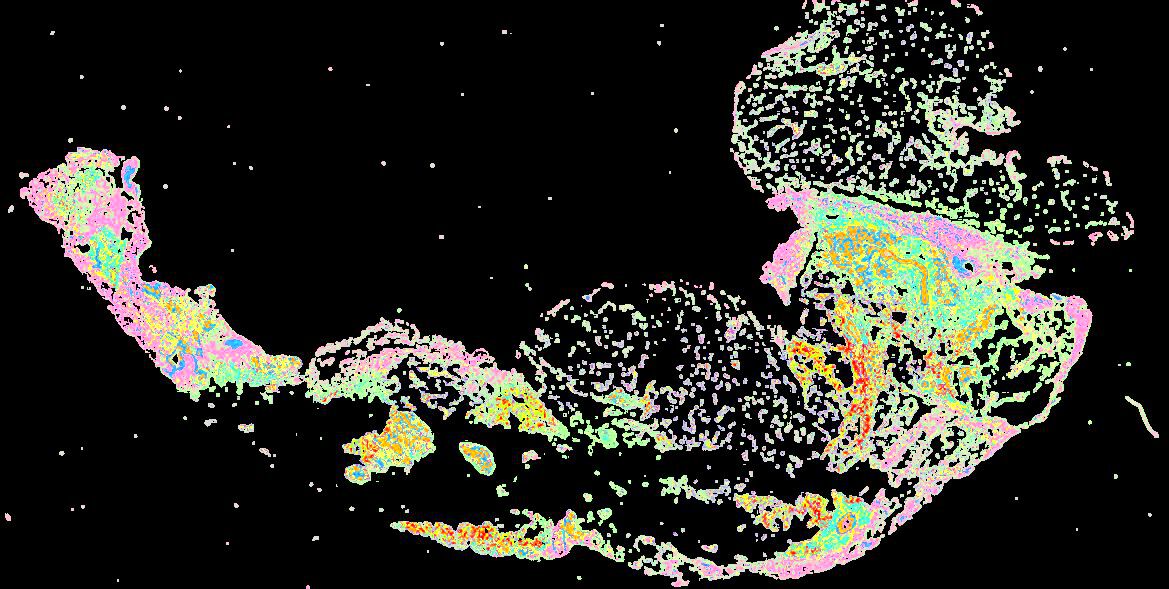
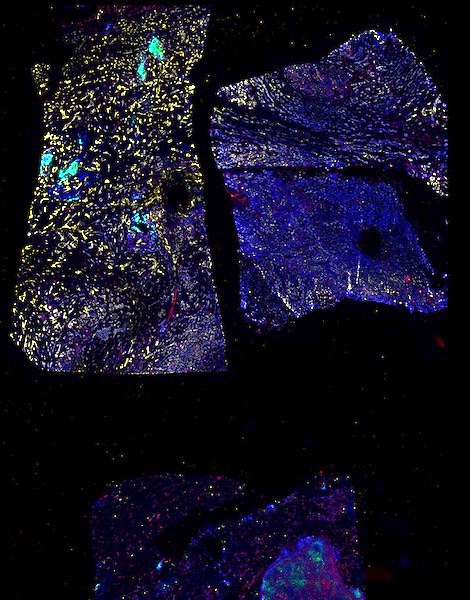
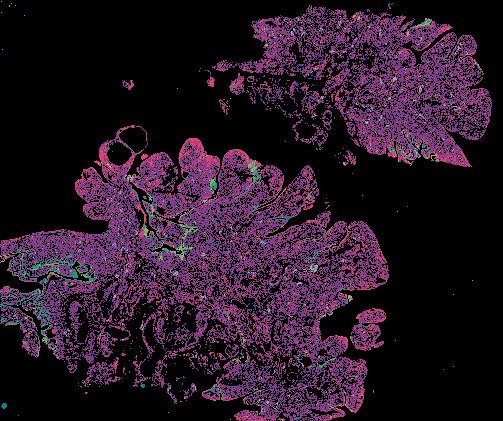
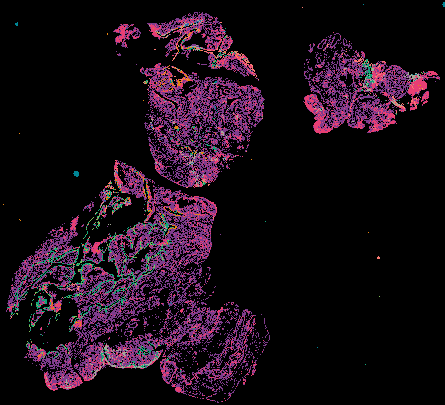
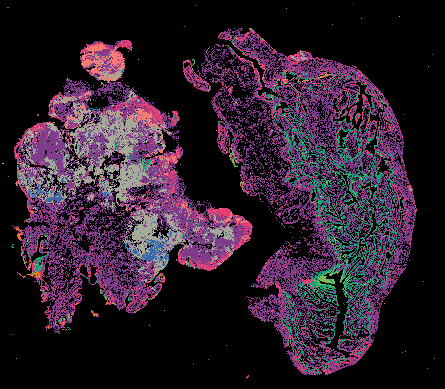
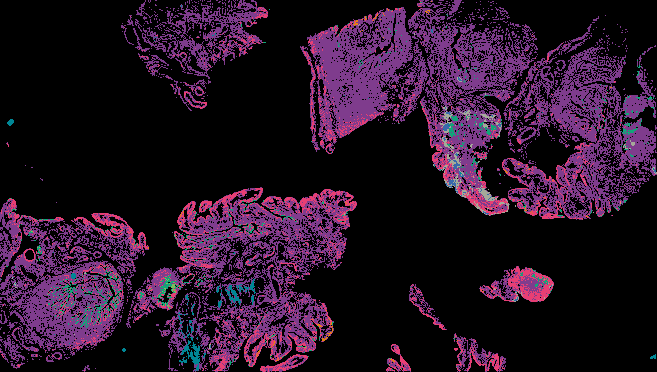
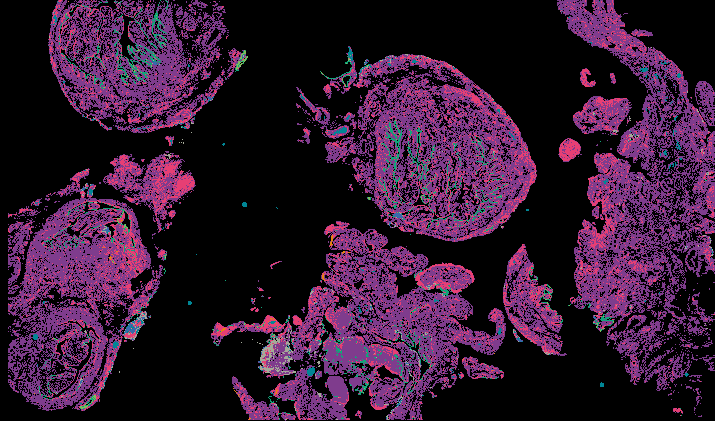
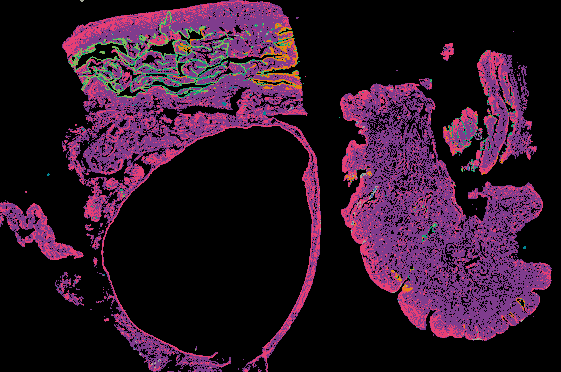
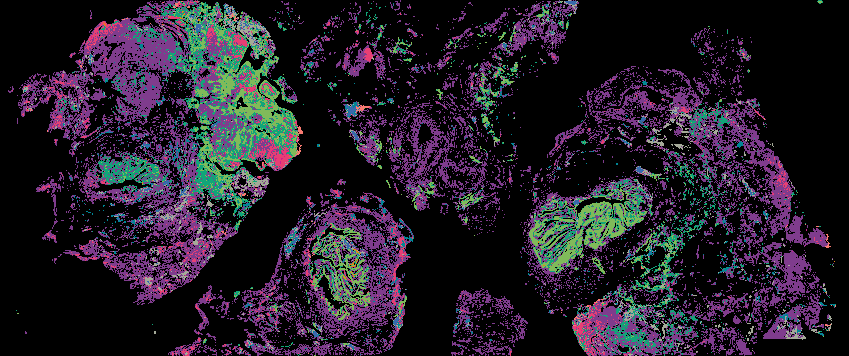
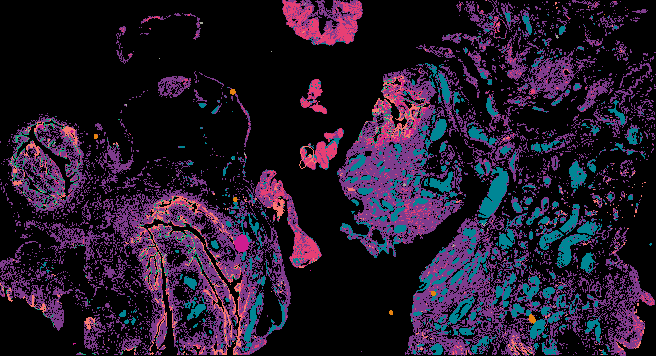
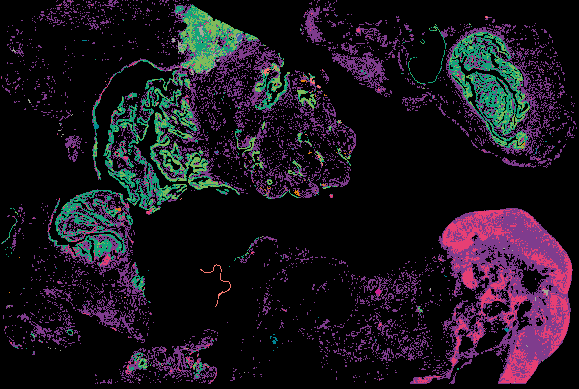
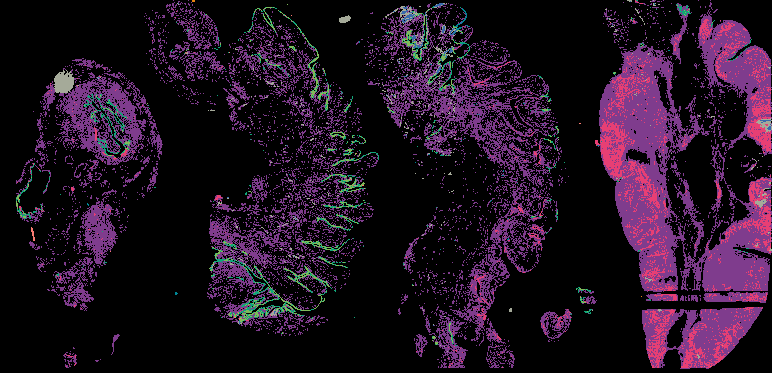
Cyclic Immunofluorescence (CyCIF) is a multiplexed imaging method that uses cycles of staining, bleaching, and imaging to generate high-plex images. A major advantage of our workflow is that it can be applied to many sample types and can generate and analyze whole slide images (WSI). WSIs enable deep spatial analyses and provide enough statistical power to make conclusions about spatial relationships that are impossible in small fields of view.
About the Data Data Levels Explore Data Online
About the Data
Method and Protocol
Learn about the CyCIF method and selected publications at https://www.tissue-atlas.org/cycif-method.
Access the CyCIF protocol on protocols.io.
Data Visualization
Full-resolution images can be viewed in a web browser using Minerva:
- via the gallery below
- in cBioPortal (forthcoming)
Learn more about the Minerva software at minerva.im.
Data Access
All image data will be accessible from Amazon Web Services (AWS):
- Level 1: rcpnl
- Level 2: OME-TIFF
- Level 3: OME-TIFF
- Level 4: csv
For a description of the files see the table below.
About the Samples
The following are planned to image with CyCIF:
- 50-100 breast samples
- 30-50 ovarian samples
Instruments
CyCIF data was collected on RareCyte CyteFinder and CyteFinder II microscopes.
About the Data Generators
This data was generated and analyzed by the Laboratory of Systems Pharmacology at Harvard Medical School.
Data Levels
CyCIF uses OME-TIFF and other BioFormats file formats and follows MITI standards.
| Data Type | Description | File Format | Average size (per sample) | Data Location |
|---|---|---|---|---|
| Raw images (Level 1) | Collected using cyclic immunofluorescence (CyCIF) | rcpnl | 80 GB | AWS |
| High-plex image data (Level 2) | Quality controlled images are assembled into a high-plex whole slide image using the MCMICRO analysis pipeline | OME-TIFF | 50 GB | AWS |
| Segmentation masks (Level 3) | Cell segmentation identifies and separates cell, nucleus, cytoplasm and other regions | OME-TIFF | 0.5 GB | AWS |
| Single-cell spatial feature tables (Level 4) | Summarize the expression of marker intensities and morphological features for each cell | csv | 1 GB | AWS |
Explore Data
Viewing image data online using Minerva
Minerva is a suite of software tools for visualizing, annotating, and sharing high-plex tissue images in a web browser with an accompanying narration. Minerva makes it possible to interact with large, whole-slide images without downloading any data or installing any software. In Minerva, viewers can annotate and share regions of interest, pan and zoom to explore different levels of detail, and view different subsets of markers.
Narrated Minerva Stories
Narrated stories use multi-step narrations and annotations to walk a viewer through key features of the data. Narrated stories distill the multidisciplinary knowledge encompassed by each dataset into a single product that grounds the scientific analyses in the underlying data and metadata. Click the Minerva story icon for an interactive view of the full-resolution images.
Curated Minerva Stories
Curated stories provide access to images that have undergone a quality control step to remove failed markers, ensure appropriate channel intensity settings, and provide metadata about the underlying sample and image. Click the Minerva story icon for an interactive view of the full-resolution images.