GeoMx Microregional Spatial Transcriptomics
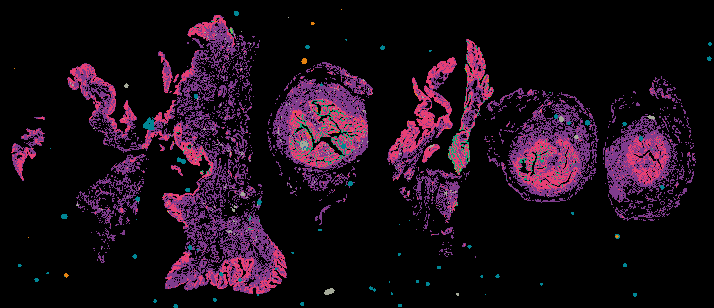
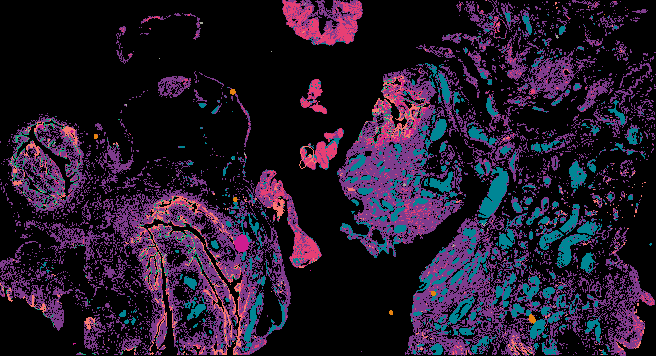
GeoMx microregional spatial transcriptomics detects high-plex protein and RNA expression within FFPE-embedded tissues to measure gene expression across the entire transcriptome. We combine this method with H&E and CyCIF images to select region of interests (ROIs) for GeoMX analysis.
About the Data Data Levels Explore Data
About the Data
Method and Protocol
Learn about the GeoMx method by reading:
- Zollinger, Lingle, Sorg, Beechem, Merritt. (2020). Methods in Molecular Biology. DOI: 10.1007/978-1-0716-0623-0_21
Data Visualization
Full-resolution images can be viewed in a web browser using Minerva:
- via the gallery, below
- in cBioPortal
Learn more about the Minerva software at minerva.im.
Data Access
Data will be accessible from the following:
- Levels 1: FASTQ (GEO)
- Level 3: DCC (GEO)
- Level 4: csv (AWS)
For a description of the files see the table below.
About the Samples
The following are planned to image with GeoMx:
- 65 ovarian samples
Instruments
GeoMx data was collected on a Nanostring GeoMx Digital Spatial Profiler (DSP).
About the Data Generators
This data was generated and analyzed by the Laboratory of Systems Pharmacology at Harvard Medical School.
Data Levels
| Data Type | Description | File Format | Average size (per slide) | Data Location |
|---|---|---|---|---|
| Level 1 | Raw sequencing files | FASTQ | GEO | |
| Level 3 | Count data for each collection plate | DCC | GEO | |
| Level 4 | Log normalized gene expression data | csv | 150 MB | AWS |
| All files | Total per slide | 12 GB |
Explore Data
Data Access and Data Visualizations
Click any of the following thumbnail images to access associated data or data visualizations. Data visualizations guide readers through the complexities of a large dataset through filters, search, or narrated image waypoints.
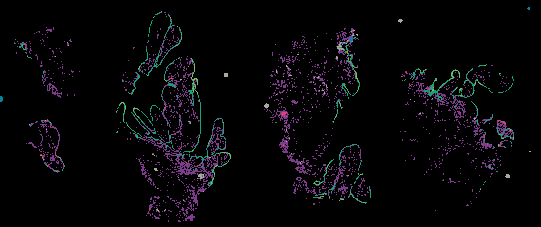
Curated Minerva Stories
Curated stories provide access to images that have undergone a quality control step to remove failed markers, ensure appropriate channel intensity settings, and provide metadata about the underlying sample and image. Click the Minerva story icon for an interactive view of the full-resolution images.