ORION-FISH
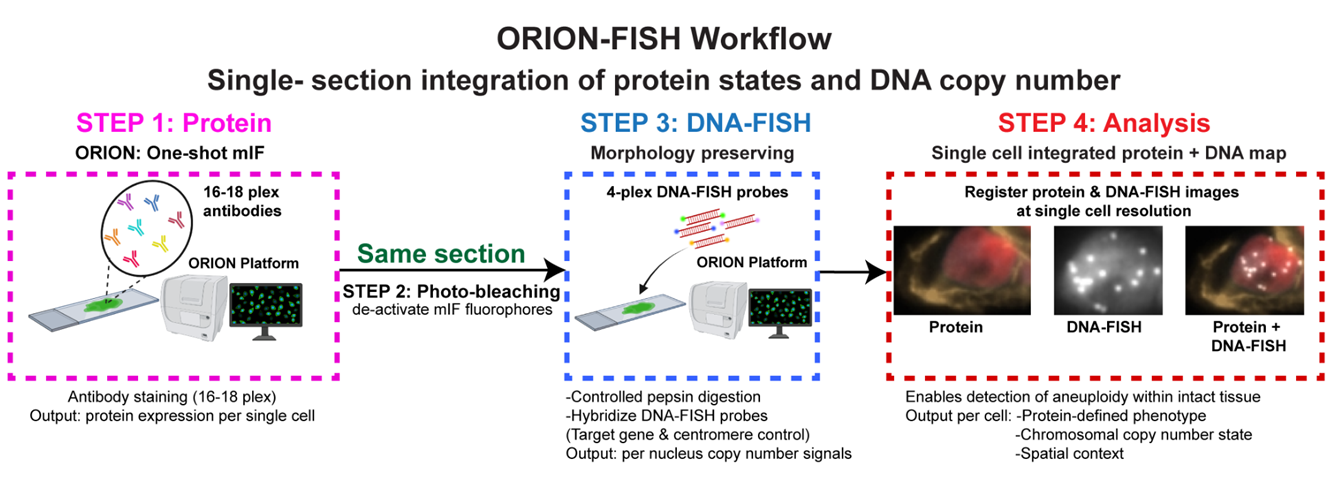
ORION-FISH is developed using the ORION platform. Orion is a method for collecting one-shot and multi-cycle 18-plex immunofluorescence images. Following ORION staining and imaging, a morphology-preserving DNA-FISH assay was applied to the same FFPE section. In this way, ORION-FISH, which integrates high-plex tissue imaging with a morphology-preserving DNA-FISH protocol and single-cell registration/scoring, yielding measurements concordant with clinical FISH. ORION-FISH enables a biology-first approach to spatial genomics: providing a practical, scalable bridge between high-dimensional genotype-phenotype maps and human-interpretable, tissue-based validation. The framework is readily implementable in research laboratories while remaining naturally aligned with clinical pathology workflows. We are applying this method to map chromosomal changes and link aneuploid cells to the immune microenvironment and cancer progression.
About the Data
Method and Protocol
Learn about the ORION-FISH method by reading:
- Kader T, Chen Y-A, Hug CB, et al. Cancer Discovery (2026). DOI:https://doi.org/10.1158/2159-8290.CD-26-0171
Data Visualization
Full-resolution images can be viewed in a web browser using Minerva:
- via the gallery (forthcoming)
- in cBioPortal (forthcoming)
Learn more about the Minerva software at minerva.im.
Data Access
All image data will be accessible from Amazon Web Services (AWS):
- Levels 1: rcpnl
- Level 2: OME-TIFF
- Level 3: OME-TIFF
- Level 4: csv
For a description of the files see the table below.
About the Samples
The following have been imaged with ORION-FISH:
- 38 ovarian samples
Instruments
Information forthcoming
About the Data Generators
This data was generated and analyzed by the Laboratory of Systems Pharmacology at Harvard Medical School.
Data Levels:
| Data Type | Description | File Format | Average size (per sample) | Data Location |
|---|---|---|---|---|
| Raw images (Level 1) | Collected using ORION | rcpnl | AWS | |
| High-plex image data (Level 2) | Quality controlled images are assembled into a high-plex whole slide image using the MCMICRO analysis pipeline | OME-TIFF | 100 GB | AWS |
| Segmentation masks (Level 3) | Cell segmentation identifies and separates cell, nucleus, cytoplasm and other regions | OME-TIFF | 0.5 GB | AWS |
| Single-cell spatial feature tables (Level 4) | Summarize the expression of marker intensities and morphological features for each cell | csv | 1 GB | AWS |
 Click to enlarge.